Spring 2025
Explaining Montana commodity, energy, and mineral supply chains.

Montana is known for its wide open spaces and beauty above the surface but few account for the geologic beauty below the surface. Above ground, as of 2022 Montana sold $6.2B of agricultural goods, $5.8B in travel, and $617M in timber products. Below the surface lay minerals and oil, a combined $4.4B industry that are used in industry and energy production which is the focus of this paper divided into three sections called commodities, energy, and minerals.
- Commodities, explaining what hard/soft commodities are produced here, what is imported and exported, and how much of it.
- Energy, demand forecasts, US and Montana maps of where it comes and goes.
- Mining, coal, Wyoming, and Montana active mines.
The objective is to expand upon a personal understanding of Montana commodities, energy, and mineral supply chain and to educate locals about the resources around them.
If you like this content or have a research idea, please reach out, we also write a free weekly e-newsletter called the bozemanbuild.com covering Northern Rockies blue collar and business news.
Enjoy – DZ
*We are not financial advisors or have any idea what we are talking about nor was this paper peer edited, these topics are complex, and change rapidly. We are not responsible for this paper. This information is for general informational purposes only and does not constitute professional advice. Please consult with a qualified professional before making any decisions based on this information.
PDF VERSION
Commodities
Before we look at a handful of graphs, economics, and numbers, let’s start with something kid friendly, an infographic geared more towards agriculture. In 2021, Montana had cattle receipts of $1.6B, Wheat $1.1B, Hay $430M, Barely $200M, and Lental’s around $100M.

What is Montana producing and how much of it?

Montana Import and Export
In 2021, Montana imported over 1,900 products and exported over 1,300 products. These products were imported from over 112 countries and exported to 138 countries. Montana imported $6.5B worth of goods and exported $2B. Notice how we import much more than export? The State of Montana offers things like the STEP or State Trade Expansion Program to help our exports grow.

Montana Imports
Montana’s top 5 imports are Crude Oil at $4.25B, Platinum Waste & Scrap $215M, Wood Products $160M, Urea $116M, and Natural Gas $97M. Crude oil is imported to Montana to be refined into petroleum products. Montana has four refineries—three in the Billings area, and one in Great Falls— which have a combined crude oil processing capacity of 224,100 barrels per day— roughly 1.2% of total U.S. capacity.

Montana Exports
Montana’s largest exports are coal, copper. cattle , high tech and electrical energy. The State is also known for its quantum, photonics, and computer component manufacturing.

Energy
Now that we have a basic understanding of what Montana buys and sells, let’s take a look at how this State is powered. With oil we demonstrate where it’s produced, refined, and distributed. With electricity we cover demand, generation, and transmission lines. Most of the energy maps below were provided by the Montana DEQ deq.mt.gov/energy/resources
Montana Oil Production
In September 2006, Montana hit a production record of 102,000 barrels per day and hit a low in 1999 at 38,000 BPD. As of February 2025, Montana produced 73,000 BPD, if all 73,000 barrels went through In-State processing, that would only make up 1/3rd of crude input while 2/3rd comes from Canada. Production ebbs and flows with the prices of gasoline.


Montana processes over 215,000 barrels per day (BPD) making up for only 1.2% of the US total production capacity.

Here’s a list of Montana refineries and their estimated production capacity, (Block Biome Research)
| Town | Company | est. BPD |
| Laurel | CHS Inc. | 60,000 |
| Billings | Conoco Phillips Inc. | 62,900 |
| Billings | Par Pacific Holdings | 64,000 |
| Great Falls | Calumet Montana Refining LLC | 25,000 |
* Exxon sold to Par Pacific in 2023
Here’s a list of Wyoming refineries and their estimated production capacity (Block Biome Research)
| Town | Company | est. BPD |
| Sinclair | Sinclair Refinery | 80,000 |
| Cheyenne | HollyFrontier Refinery | 52,000 |
| Casper | Sinclair’s Little America Refinery | 24,500 |
| Newcastle | Par Petroleum Inc | 14,000 |
| Douglas | Antelope Refining | 4,500 |
| Evanston | Silver Eagle Refining | 3,000 |
Montana Pipelines
As mentioned in the 2021 imports section, we import loads of crude from Canada (over $4.3B in 2021), this crude gets piped to all four of Montana’s refineries. Canadian oil or Western Canadian Select (WCS) is a heavy sour blend of crude oil that is one of North America’s largest heavy crude oil streams and, historically, its cheapest. Read more about the autonomy of Alberta Crude at OilSandsMagazine. The Petroleum in Montana map identifies crude product pipelines coming from Alberta South, some making a pitstop around Great Falls and Billings to be refined into something usable.

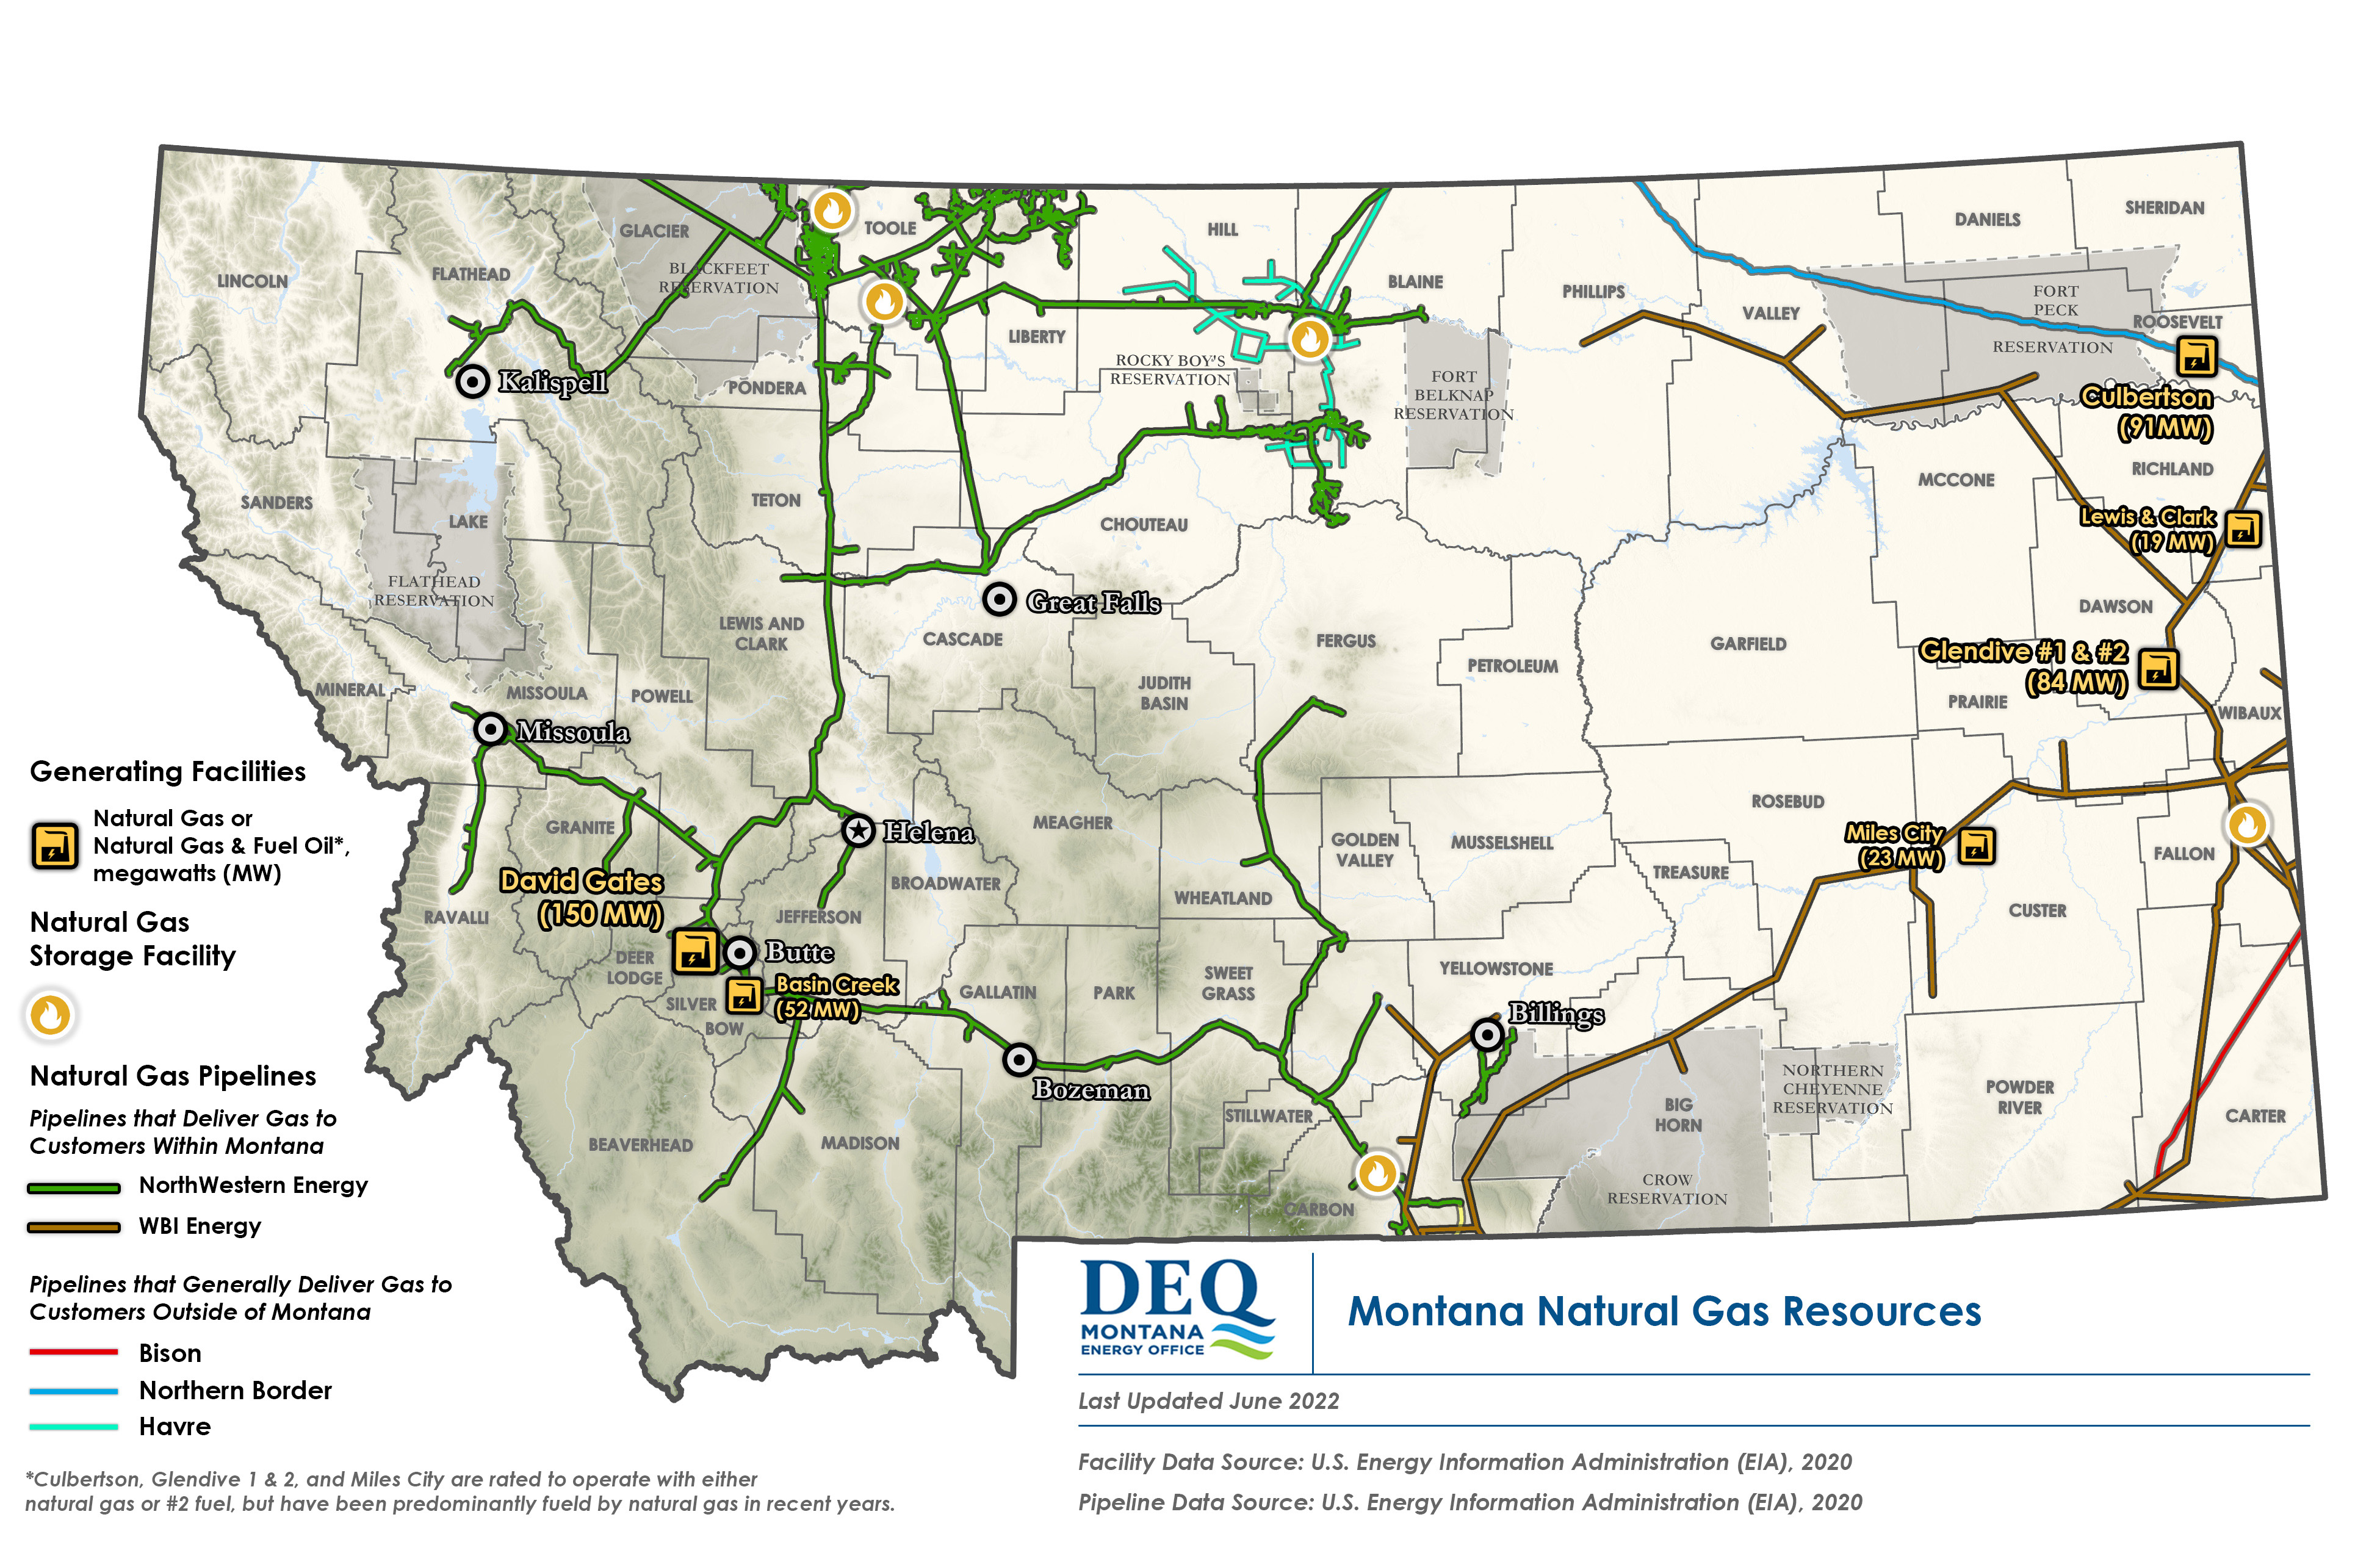
Montana Natural Gas Resources
The majority of Montana pipelines are owned by Northwestern Energy and WBI energy. These pipelines provide reliable natural gas to Montana towns and cities. There are six total natural gas generating stations across the State strategically positioned near the Bakken formation putting to work excess natural gas.

Electricity
- Montana has the nation’s largest recoverable coal reserves, which is 30% of the U.S. total, and the state accounts for about 5% of U.S. coal production.
- Montana’s temperature extremes and small population contribute to the state’s residential sector having the highest per capita energy consumption of any state.
- In 2023, Montana ranked among the top 10 states with the largest share of electricity generated from renewables, about 50%.
- Coal-fired power plants provided the largest share of Montana’s electricity generation in 2023, accounting for 45% of in-state generation.
- Montana’s total natural gas consumption is among the five lowest states. About half of state households use natural gas as their primary energy source for home heating.
Quick Facts and chart from Quick Facts from the EIA MT
Electric Demand Projections
Published April 25, 202 was the Northwest Power and Conservation Councils 9th Power
Plan Demand Forecast claiming that demand for electricity in the Northwest could double by 2046. During the next two decades, demand could increase by between 1.8% and 3.1% annually, the Northwest Power and Conservation Council heard Tuesday. The projected growth will come primarily from companies building more data centers in the region, more electric vehicles on roads, electrifying buildings, computer chip manufacturing and the production of “green hydrogen” created by running an electrical current through water to split the molecules into hydrogen and oxygen.
Electricity Maps App shows where electricity is flowing across the world and how it’s generated.

Montana Electric Generation
We are fortunate to have a diversified set of energy generation sources across the State.


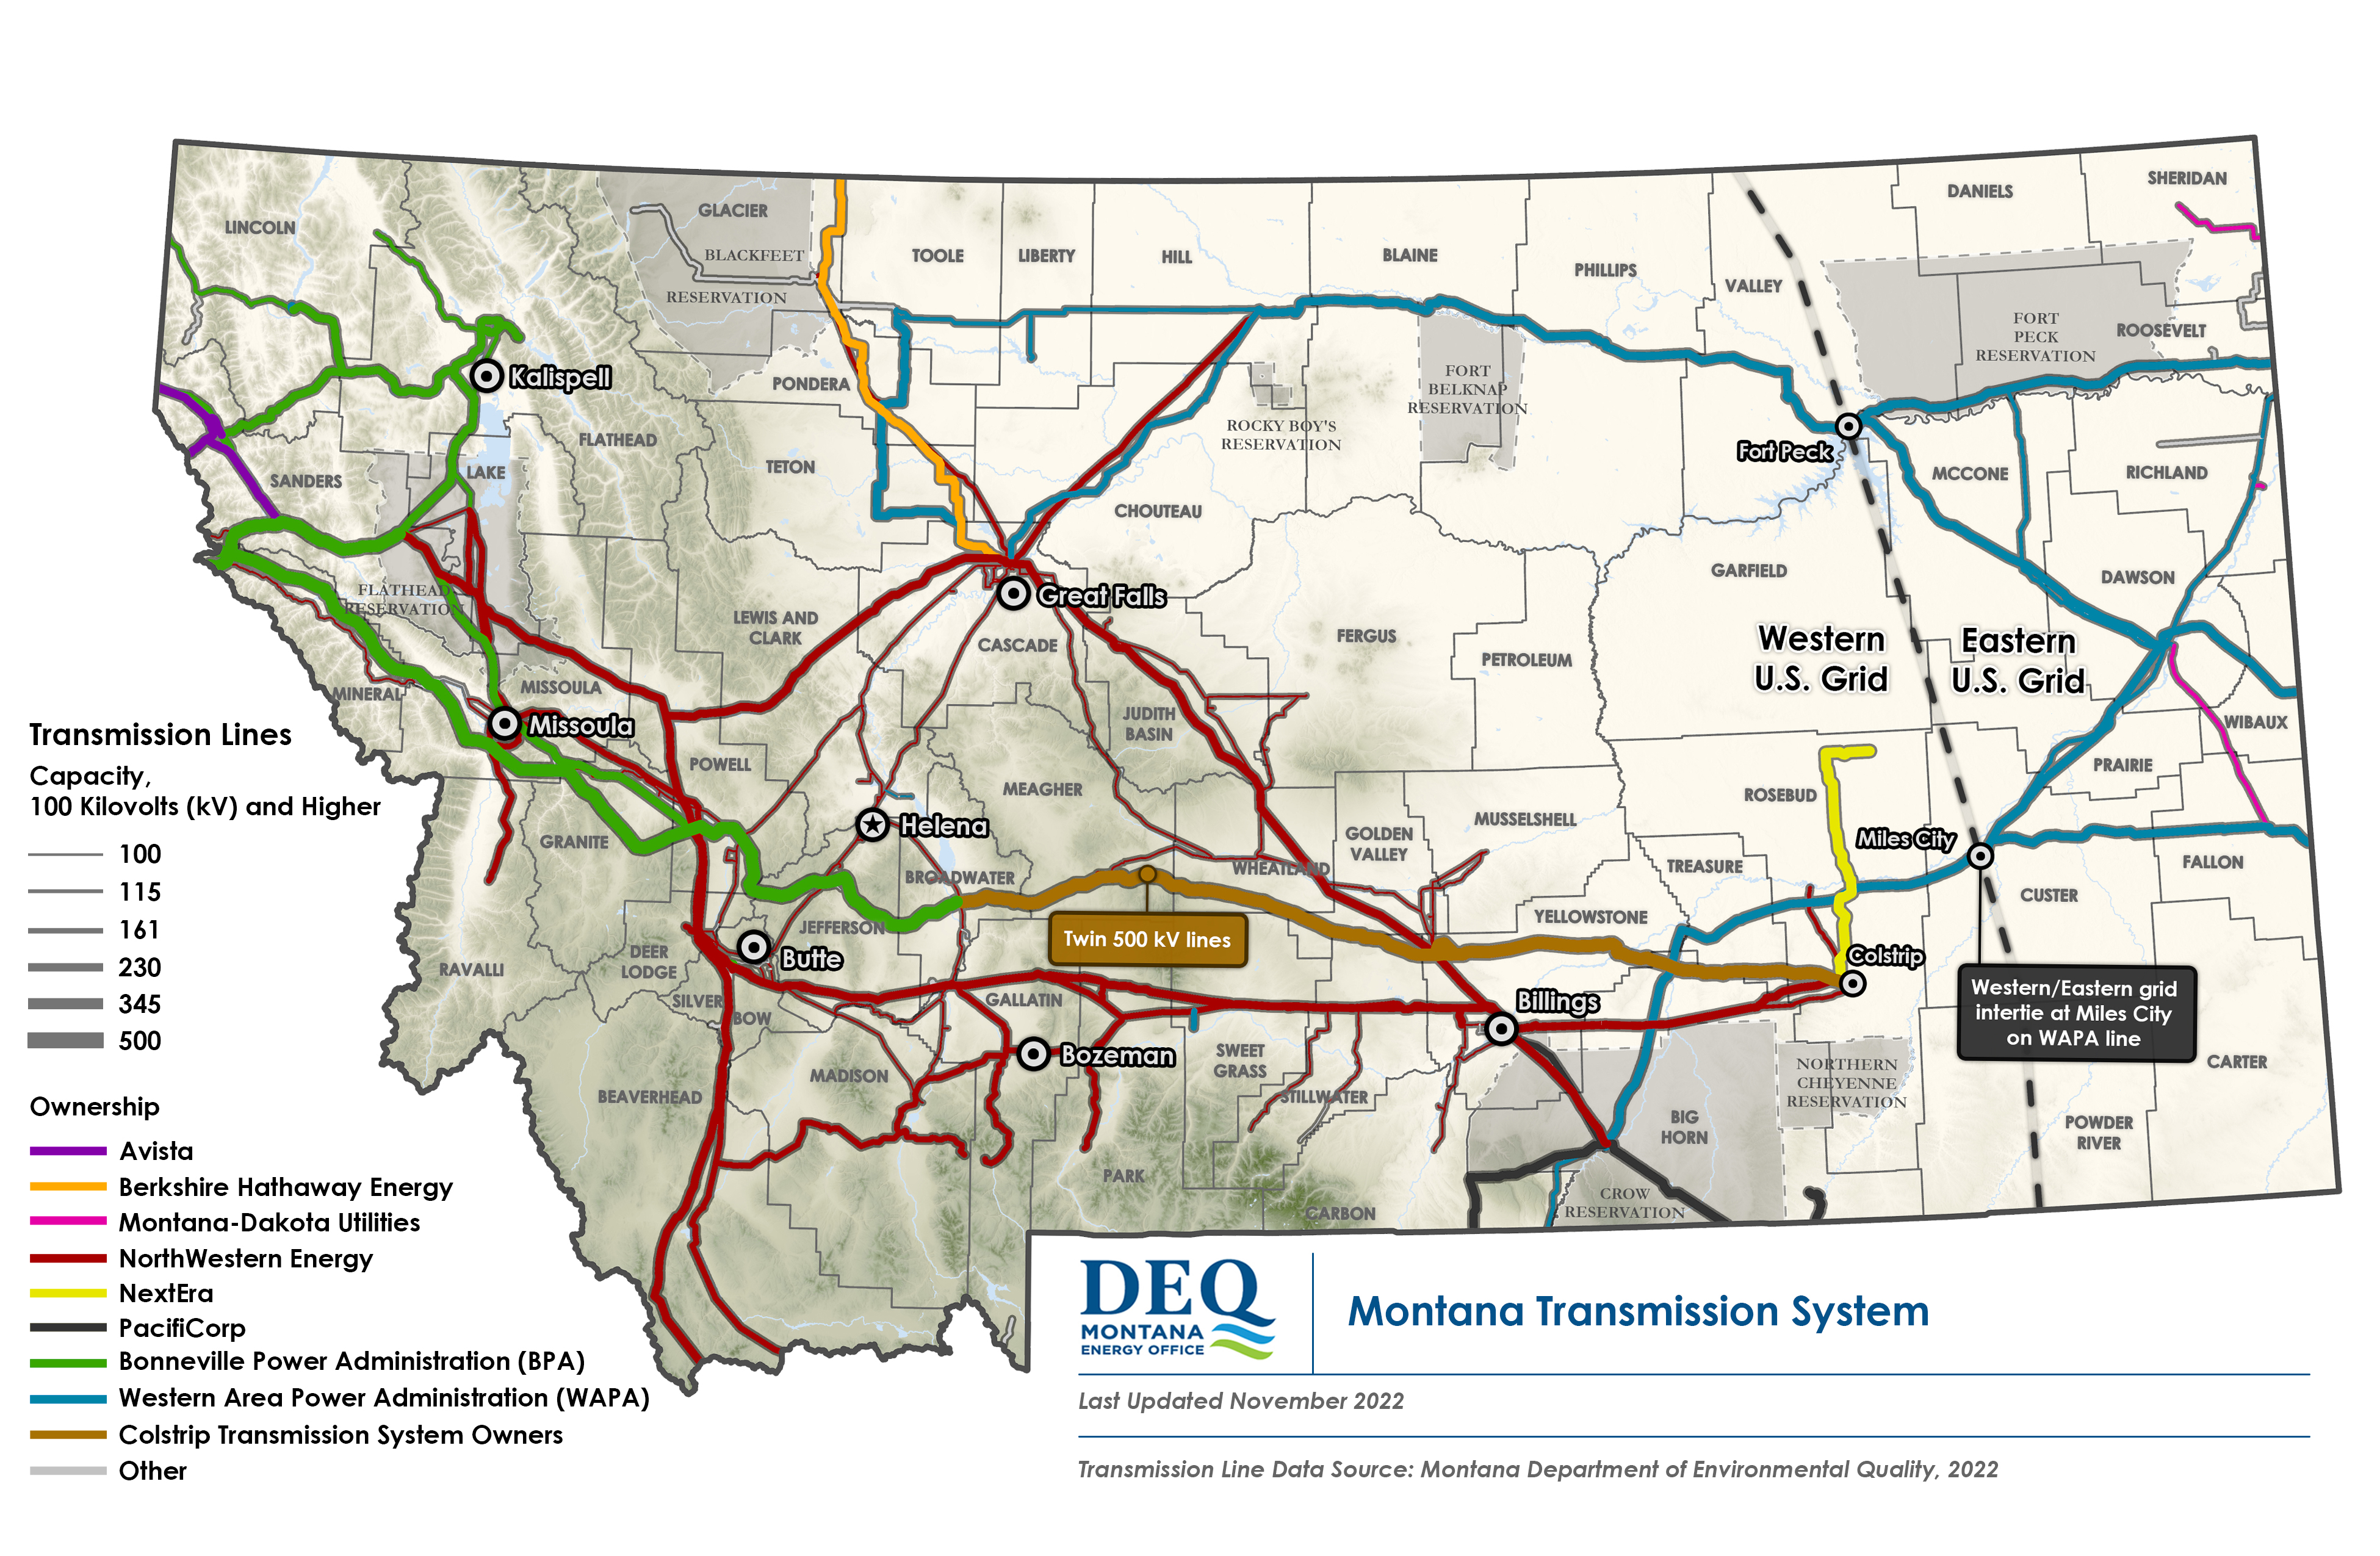
Montana Transmission System
Northwest is the majority owner of Montana transmission lines. The interesting thing here is the eastern and western US power grid coming together at Miles City and Fort Peck. There’s currently a project in development called the North Plains Connector Project (NPC) which would would provide 3,000 megawatts (MW) of bi-directional transfer capability and connect the Western and Eastern Interconnections (also known as the western and eastern grids between Colstrip, Montana and Central North Dakota.

Mining
Montana was born from mining starting in the 1950s when traders for the Hudson’s Bay Company discovered gold near present-day Deer Lodge. The first big strike took place near Bannack in 1862. In the next two years, gold was discovered at Virginia City and Last Chance Gulch in the heart of present day Helena. (Archives West). In 1880 Marcus Daly, an Irish immigrant, and a group of California investors including George Hearst, father of publisher William Randolph Hearst, formed the Anaconda Gold and Silver Mining Company to operate a mine near Butte, Montana. (Britannica Money). Nowadays, mining isn’t as significant as it was in the 1800’s yet it still remains Montana’s 3rd largest industry valued at $2.5B as of 2022. This section discovers some nuggets of knowledge about mining, specifically mining for energy (coal), Wyoming rare earth/uranium emergence, along with a comprehensive list of all active mines across the State of Montana
Mining for Energy
Montana produces primarily subbituminous coal from the Powder River Basin which has a lower heat content compared to other U.S. coal basins, but it burns cleaner because of its relatively low sulfur content. Montana has the largest coal reserves in the country, estimated to be over 100 billion tons. Historically, total coal production in the state has averaged near 40 million tons per year Production has been moving downward since 2018 and dropped sharply in 2020 but has received increased support since the Trump Administration took office in 2025. Since 2025, coal is regained support from the feds.
- December 6, 2024 Republican attorneys general in 11 states, including Montana’s Austin Knudsen, filed a joint lawsuit last month against BlackRock, Vanguard and State Street, claiming the organizations’ efforts to pressure coal companies to lower carbon emissions and respond to climate change amount to anti-competitive business practices. (Daily Montanan)
- December 13, 2024 – Montana, Wyoming sue feds to repeal Powder River Basin Coal Leasing Ban (Daily Montanan)
- March 14, 2025 Decision is a reversal from the Biden administration, will keep coal mining in southern Montana for at least another 16 years (Daily Montanan)
- April 08 2025 The Department of the Interior Moves to Restore Coal Industry (DOI)
- April 08 2025 Unleash American Energy signed (State of Montana Newsroom)

Wyoming Uranium and Rare Earths
The State of Wyoming has been interestingly investing more recently into nuclear energy mining especially since TerraPower made their Kemmerer Power Station Unit 1 announcement which is a Natrium reactor .
- January 14, 2025 – TerraPower Awarded Pivotal State Permit for aNatrium® Plant (Terra Power)
- April 7, 2025 – Eleven governors and their state energy offices are putting out ready-for-business signs to advanced nuclear energy developers under an initiative that taps into experts at the Idaho National Laboratory (INL).
- April 09, 2025 $30 Million Investment Bets On Glenrock Being Wyoming’s Next Uranium Hot Spot (Cowboy State Daily)
- April 16, 2025 Wyoming Rare Earths Could Be Processed At Retooled Plant In Utah (Cowboy State Daily)
- May 02, 2025 Gov. Mark Gordon signed a tri-state agreement with Idaho and Utah April 29, pledging to contribute to the growing industrial ecosystem supporting nuclear energy in those three states. (Cowboy State Daily)
Here’s a small handful of uranium and rare earth companies operating around Wyoming.
| Company | Mine | Material |
| American Rare Earths | Rare Earth Halleck Creek | REE |
| Energy Fuels Inc | Nichols Ranch ISR Mine & Plant | Uranium Processessing |
| Ramaco Resources | Brook Mine near Ranchester | Coal and REE |
| Peninsula Energy | Lance Project | Uranium Mining |
| Ramaco Resources | Brook Mine near Ranchester | Coal and REE |
| Rare Element Resources Ltd | Bear Lodge Project | REE |
Montana Mining
Back to Montana, In 2024, Montana only ranked 30th or $1.13M for mineral production, Nevada was ranked 1st at $9.97B for reference. Montana’s principal commodities were cement, copper, molybdenum mineral concentrates, palladium metal, sand and gravel (construction). Below is an information map of Montana’s active mines as of 2012 published by Montana Tech.

The following data table gives nonfuel mineral commodity production data for Montana extracted from Table 5 in the 2019 Minerals Yearbook Statistical Summary. Note that these figures are outdated and were generated from surveys.

We synthesized this map categorizing active mines by those in active production and development. Please note that ownership and operation status can change frequently, we cannot guarantee the accuracy of the list below. (Block Biome Research)
| Region | Mine | Mineral | Company |
| NW | Troy Unit | CU, Ag | Genesis, Inc / Revett Minerals |
| NW | Walnut Placer | Au | Jim Williams, John Cochran |
| NW | Trout Cr Placer | Au | Dave Gull |
| NW | Calumet | Au | Shannon Anderson |
| NW | Misco Placer | Au | John Hageman |
| NW | Gem Mountain | Sapphires | Chris Cooney |
| NW | Garnet Mines | Au | Grant Hartford Corp. |
| NW | Weasel Cr//Douglas Cr Placer | Au | Jack Jones |
| NW | Wilson Cr Placer | Au | Gordon Jones |
| NW | American Gulch Placer | Au | Earl Stucky |
| NW | Ophir Placer | Au | Jim Durst/Clark Smith |
| NW | Pioneer Placer | Au | Golden Rule Mining |
| NW | Big Nugget | Au | Potentate Mining |
| Butte | Continental Pit | Mo, Cu, Ag | Montana Resources |
| Butte | Trident Quarry | Portland cement | Holcim Inc. now GCC |
| Butte | Threeforks Mill | Talc | IMRYS to Magris |
| Butte | Sappington Mill | Talc | Rio Tinto Minerals to Magris |
| Butte | Edgerton/Green Campbell Mine | Au, Ag | Rodney Parker |
| Butte | Treasure Mine | Talc | Barretts Minerals Inc./ Specialty Minerals, Inc. |
| Butte | Regal Mine | Talc | Barretts Minerals Inc./ High Divide Materials / 406 Minerals |
| Butte | Spring Gulch Placer | Au | Jim Crouch |
| Butte | Grasshopper Placer | Au | Paul Antonioli |
| Butte | Yellowstone Mine | Talc | IMRYS / Magris Resources Inc |
| Helena | Drumlummon Mine | Au, Ag | RX Gold and Silver, Inc /U.S. Silver and Gold, Inc |
| Helena | Scratchgravel Placer | Au | Bud Guthrie |
| Helena | Black Butte Mine | Fe | Sandfire America Resources America Inc |
| Helena | Montana City Quarry | Portland Cement | Ash Grove Cement |
| Helena | Indian Cr. Quarry | Burnt Lime | Ash Grove Cement / CRH Company |
| Helena | Hardcash Mine | AU | Reclaim, Inc. |
| Helena | Black Friday Mine | AU | Mark Runkle |
| Helena | Keating | AU | Pete Antonioli |
| Helena | Trident Quarry | Portland cement | Holcim, Inc /GCC |
| Helena | Golden Sunlight Mine | Au | Barrick Gold, Corp. |
| Helena | Mammoth | Au | Paul Antonioli/ Phil MacDonald |
| Helena | Pipestone Quarry | Stone, Railroad Ballas | Conda Mining Co. / Washington Companies |
| Helena | Golden Dream Mine | Au, Cu | Elkhorn Goldfields |
| Park | East Boulder Project | Pd,Pt, Rh, Cu, Ni, Co, Au | Stillwater Mining Co. |
| Park | Stillwater Mine | Pd, Pt, Rh, Cu, Ni, Co, Au | Stillwater Mining Co. |
| Park | Warren Limestone Quarry | Limestone | Montana Limestone Co. / Dakota Coal Company |
| Coal | Savage | Lignite | Westmorland Savage Corp. |
| Coal | Signal Peak Mine | Coal | Global Mining Holding Co., LLC |
| Coal | Rosebud Mine | Coal | Western Energy Co. |
| Coal | Absaloka Mine | Coal | Westmoreland Resources |
| Coal | Spring Creek Mine | Coal | Cloud Peak Energy |
| Coal | West Decker Mine | Coal | Decker Coal Co./Cloud Peak Energy |
| Coal | East Decker Mine | Coal | Decker Coal Co./Cloud Peak Energy |
List gathered from MINES AND EXPLORATION IN MONTANA—2012 , ownership was looked up manually. Big thanks to Robin McCulloch, Mining Engineer at Montana Tech for putting together the map.
Conclusion
In summary, Montana, Wyoming, and other surrounding States are fortunate to have a wide variety of natural resources to keep the lights on and the economy moving forward. It’s interesting to watch the market adapt based on market demands, pricing, and politics. It will forever be a revolving door. If energy consumption forecasts are true (double consumption by 2050), it will be interesting to see what the Feds, States, and power companies do to fill this need.
That’s all for today folks, hope you learned a few new things about Montana natural resources!
Contact Daniel Zavadil at daniel@blockbiome.com